Bunker Profile
The Bunker Profile module provides comprehensive tracking and analysis of fuel bunkering operations for vessels in your fleet within the AOMP. This feature allows users to monitor fuel intake operations, analyze fuel quality parameters in real-time, and generate detailed reports for operational optimization and compliance purposes.
Overview
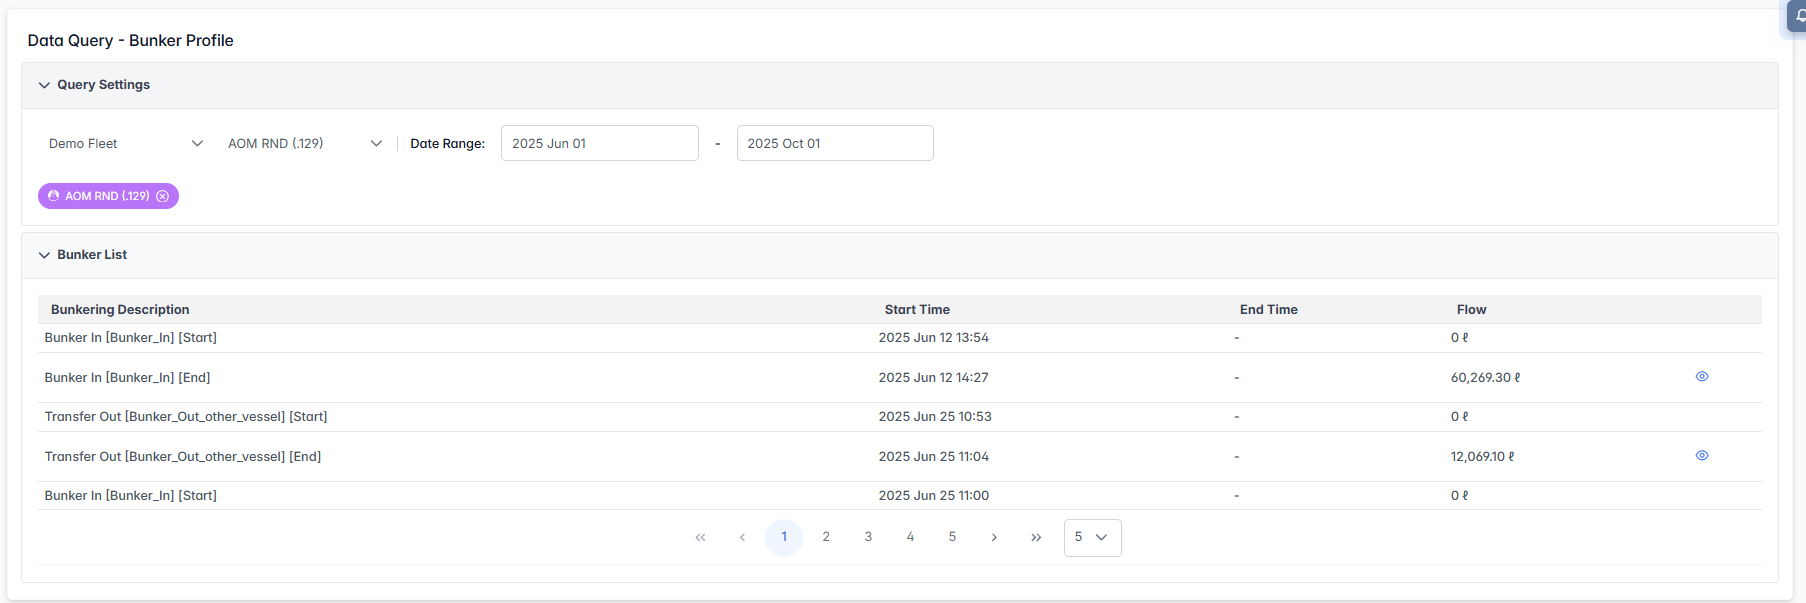
The Bunker Profile interface combines bunkering operation listings, detailed fuel quality monitoring charts, and comprehensive operation summaries to provide complete fuel intake analysis. Users can track bunkering activities, monitor fuel quality parameters (density, water content, temperature), and analyze operational efficiency for enhanced fuel management.
Interface Components
Query Settings Panel
The Query Settings panel allows you to configure bunker profile analysis parameters:
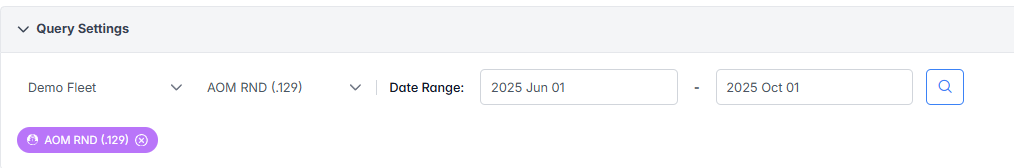
- Fleet Selector: Choose the fleet you want to analyze from the dropdown menu with vessel count display
- Vessel Selector: Select specific vessels from the filtered list, with highlighted tags showing selected vessels
- Date Range: Set start and end dates to filter bunkering operations within a specific timeframe
- Start Date: Use the calendar picker or manual input (format: YYYY MMM DD)
- End Date: Use the calendar picker or manual input (format: YYYY MMM DD)
- Apply Filters: The system automatically loads available bunker operations based on your selected criteria
Bunker Operations List
The main data table displays detailed bunkering operations:
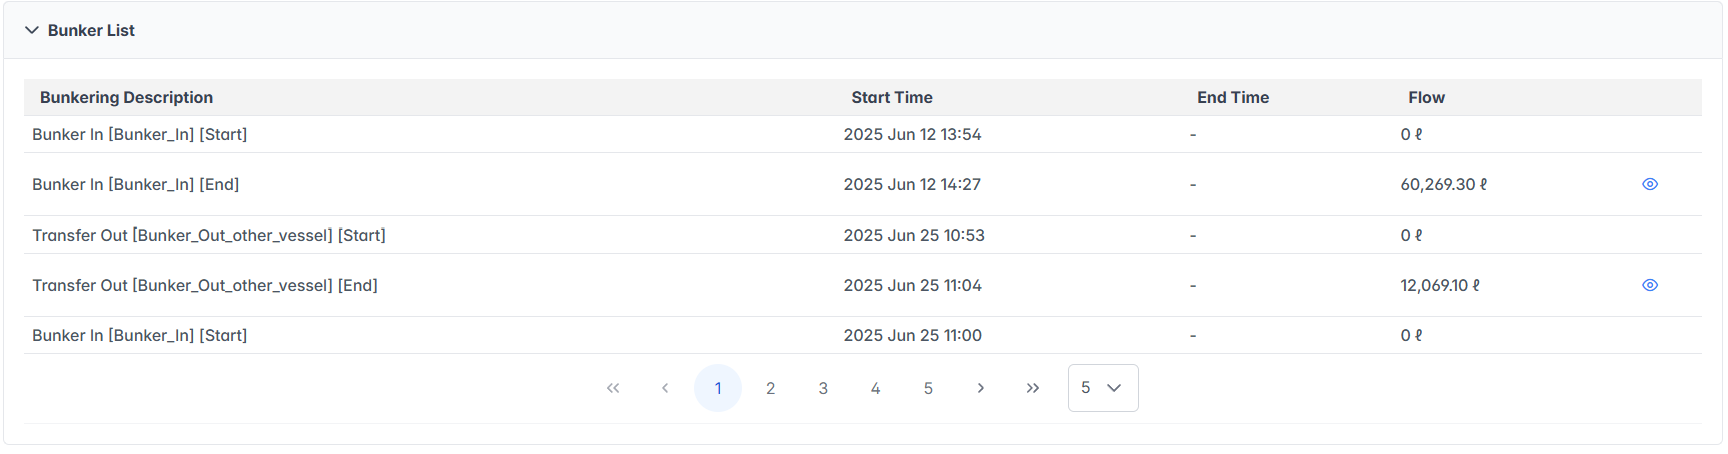
Table Columns:
- Bunkering Description: Type and status of bunkering operation
- Start Time: Exact timestamp when the operation began (format: YYYY MMM DD HH:MM)
- End Time: Completion timestamp
- Flow: Fuel flow rate or quantity in liters (ℓ)
- Shows "0 ℓ" for start operations
- Displays actual flow amounts for completed operations
Navigation Features:
- Pagination: Navigate through multiple pages using arrow controls (
<<,<, page numbers,>,>>) - Records per Page: Adjust the number of records displayed
- View Details: Click the view icon
 button in any row to access detailed bunker analysis
Detailed Bunker Analysis
When you click the view icon for a specific bunker operation, the system displays comprehensive fuel quality monitoring with real-time charts and detailed operation information.
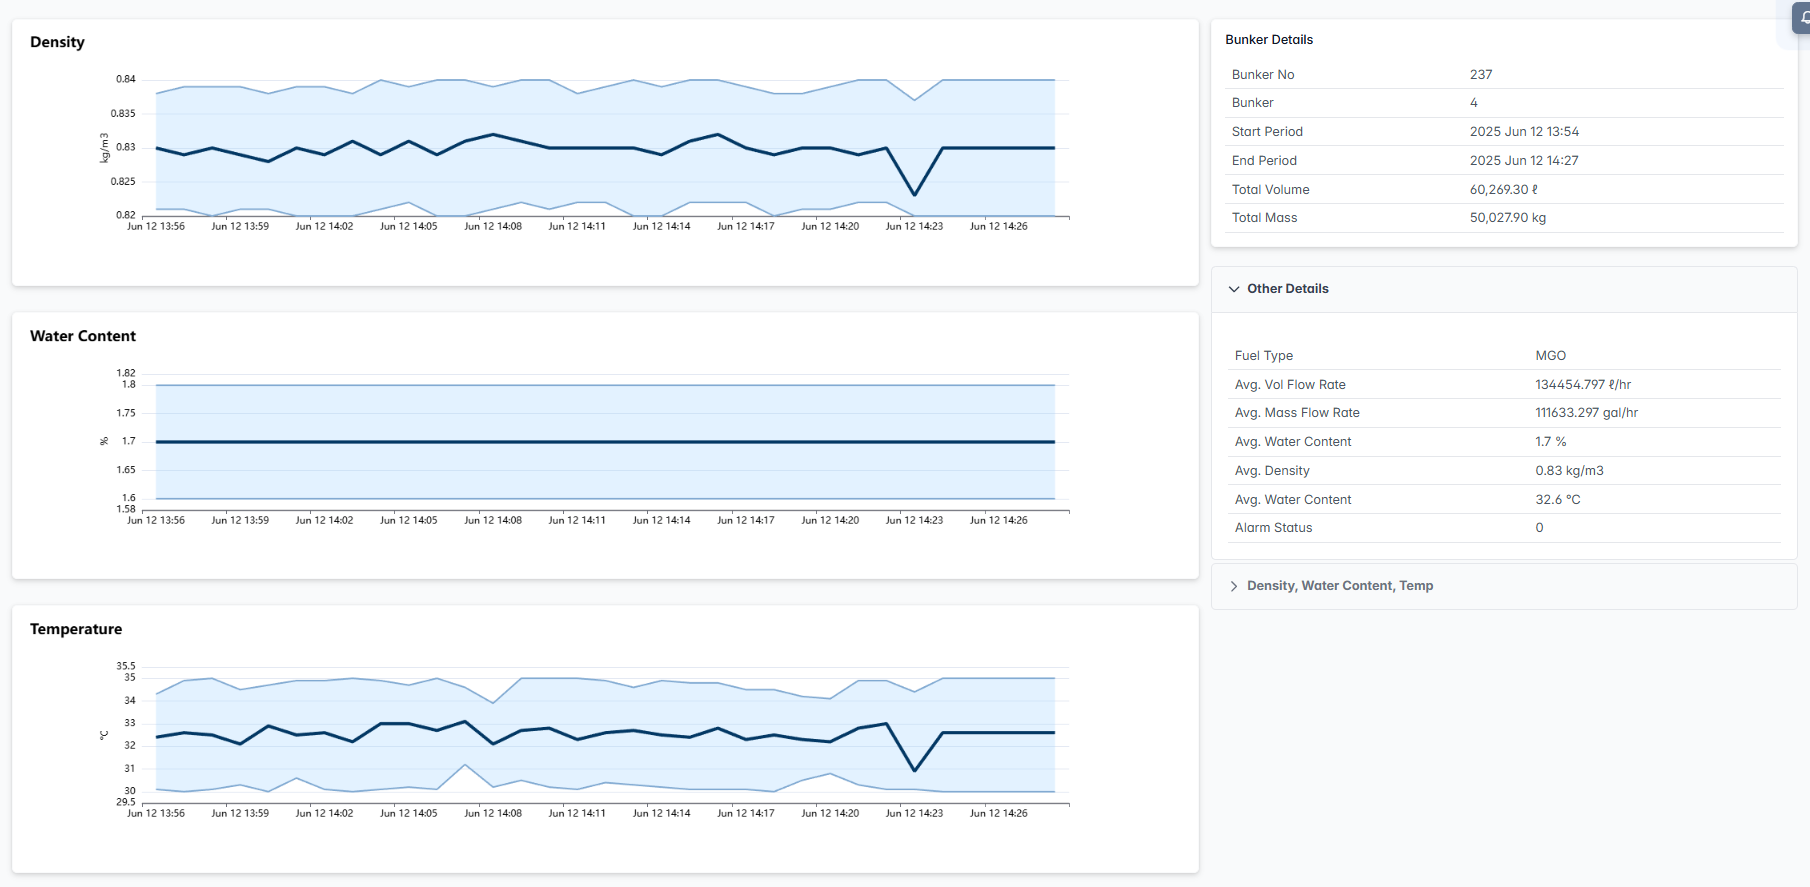
Fuel Quality Monitoring Charts
The detailed view includes three main real-time monitoring charts, each displaying maximum, minimum, and average values side by side:
Density Chart
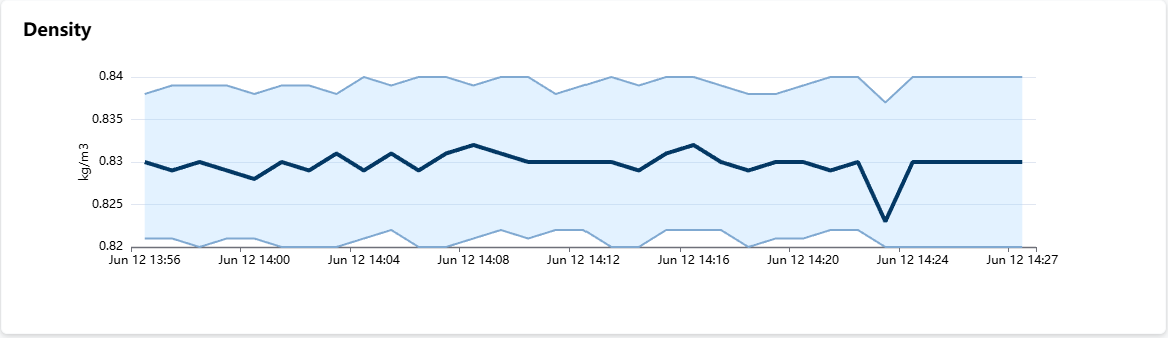
- Purpose: Monitors fuel density variations during the bunkering operation
- Y-axis: Density measured in kg/m³
- X-axis: Time progression during the bunker operation
- Visual Features:
- Dark blue line shows the average density readings
- Additional lines or markers indicate maximum and minimum density values
- Light blue shaded area represents acceptable density tolerance bands
- Real-time monitoring helps detect fuel quality variations during intake
Water Content Chart
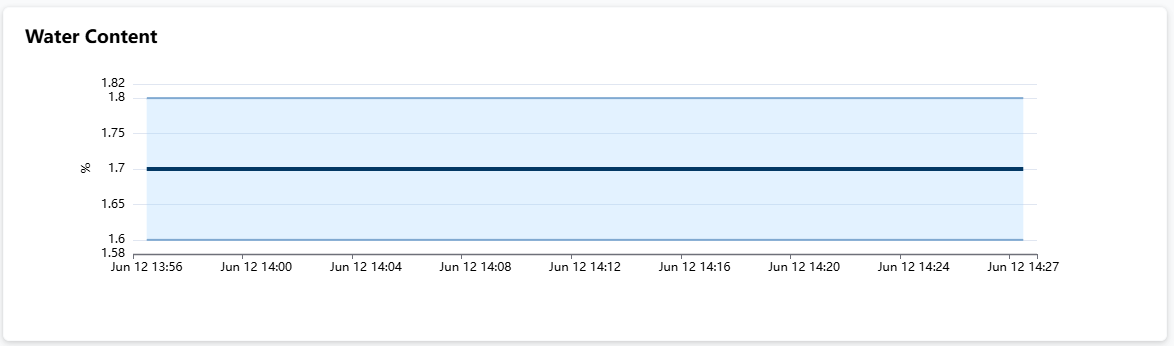
- Purpose: Tracks water contamination levels in the fuel
- Y-axis: Water content percentage (%)
- X-axis: Time progression during the bunkering operation
- Visual Features:
- Main line displays average water content
- Max and min water content values are highlighted for each time segment
- Flat average line indicates stable, acceptable water content
- Critical for fuel quality assessment and contamination detection
Temperature Chart
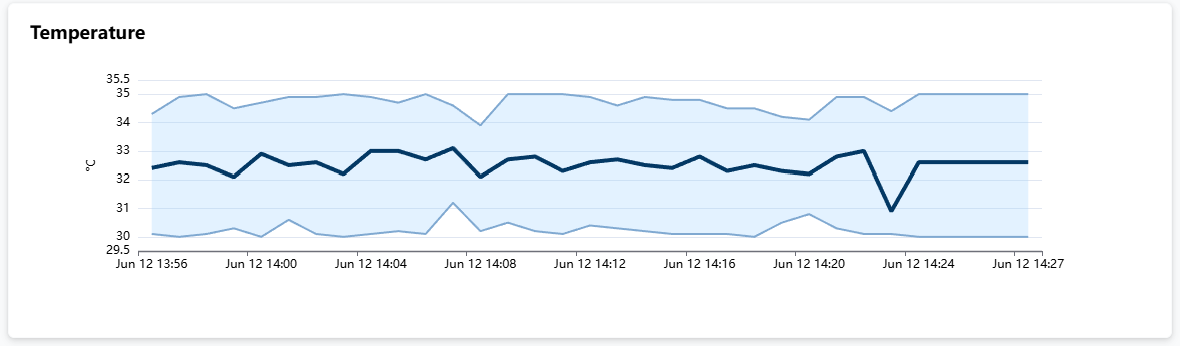
- Purpose: Monitors fuel temperature during the bunkering operation
- Y-axis: Temperature in Celsius (°C)
- X-axis: Time progression during operation
- Visual Features:
- Average temperature is tracked in real time
- Maximum and minimum temperature values are shown for each interval
- Temperature tolerance bands indicate acceptable operating range
- Important for fuel viscosity and optimal handling conditions
Bunker Details Panel
The right-side information panel provides comprehensive operation details:
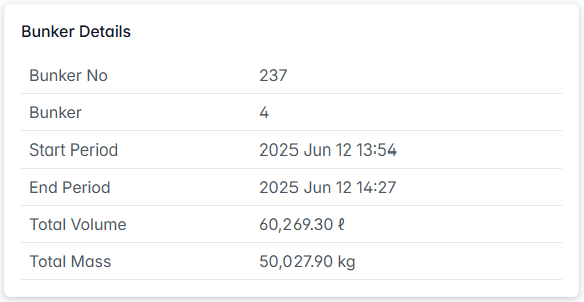
Basic Information
- Bunker No: Unique identifier for the bunker operation
- Bunker: Sequential bunker number
- Start Period: Exact start timestamp
- End Period: Exact completion timestamp
- Total Volume: Complete fuel volume received
- Total Mass: Total fuel mass in kilograms
Other Details
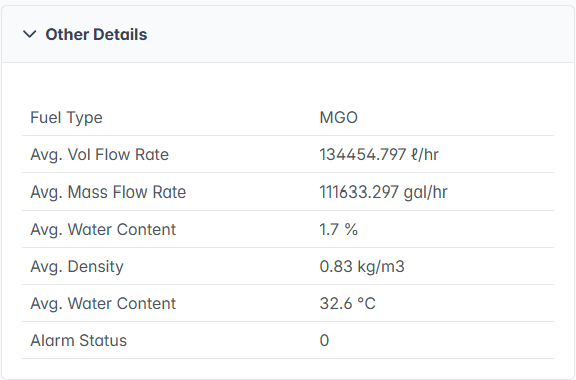
- Fuel Type: Specification of fuel grade
- Avg. Vol Flow Rate: Average volumetric flow rate
- Avg. Mass Flow Rate: Average mass flow rate
- Avg. Water Content: Average water percentage during operation
- Avg. Density: Average fuel density
- Avg. Water Content: Average fuel temperature
- Alarm Status: Current alarm state
Additional Data Section
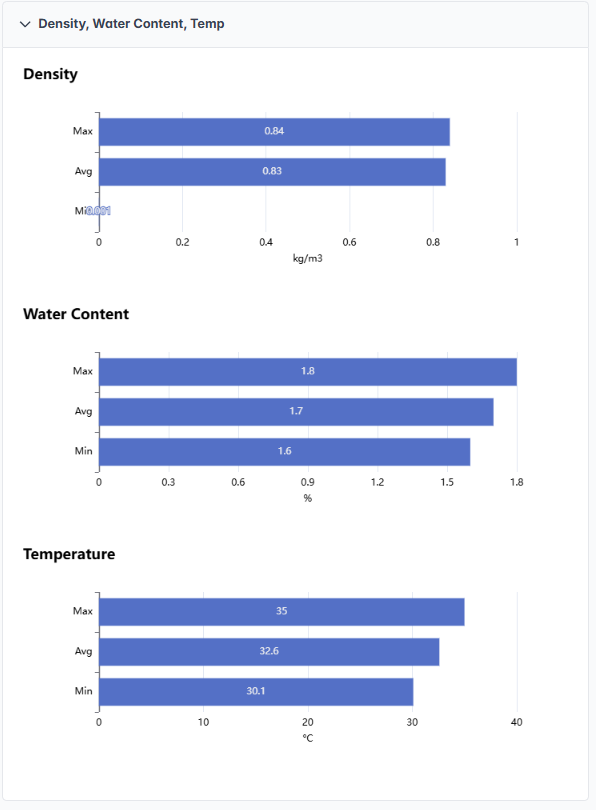
- Density, Water Content, Temp: Expandable section for detailed parameter analysis showing comprehensive statistics
Density Statistics
- Max: Maximum density value recorded during operation
- Avg: Average density throughout the bunkering process
- Min: Minimum density value observed
- Visual Display: Horizontal bar charts showing the distribution and range of density values
Water Content Statistics
- Max: Peak water content percentage detected
- Avg: Average water content during operation
- Min: Lowest water content recorded
- Quality Assessment: Visual bars help identify water content consistency and potential contamination
Temperature Statistics
- Max: Highest temperature reached during bunkering
- Avg: Average fuel temperature
- Min: Lowest temperature recorded
- Operational Context: Temperature range analysis for optimal fuel handling conditions
This expandable section provides detailed statistical analysis with visual bar representations, allowing operators to quickly assess fuel quality parameters and identify any variations that occurred during the bunkering operation.
The Bunker Profile tool is essential for fleet managers to optimize fuel management, ensure fuel quality compliance, monitor consumption patterns, and maintain efficient fuel distribution across their vessel fleet.