Trip Summary
The Trip Summary module provides comprehensive analysis and reporting of vessel journeys within the AOMP. This feature allows users to review completed trips, analyze performance metrics, monitor fuel consumption patterns, and generate detailed reports for operational optimization and compliance purposes.
Overview
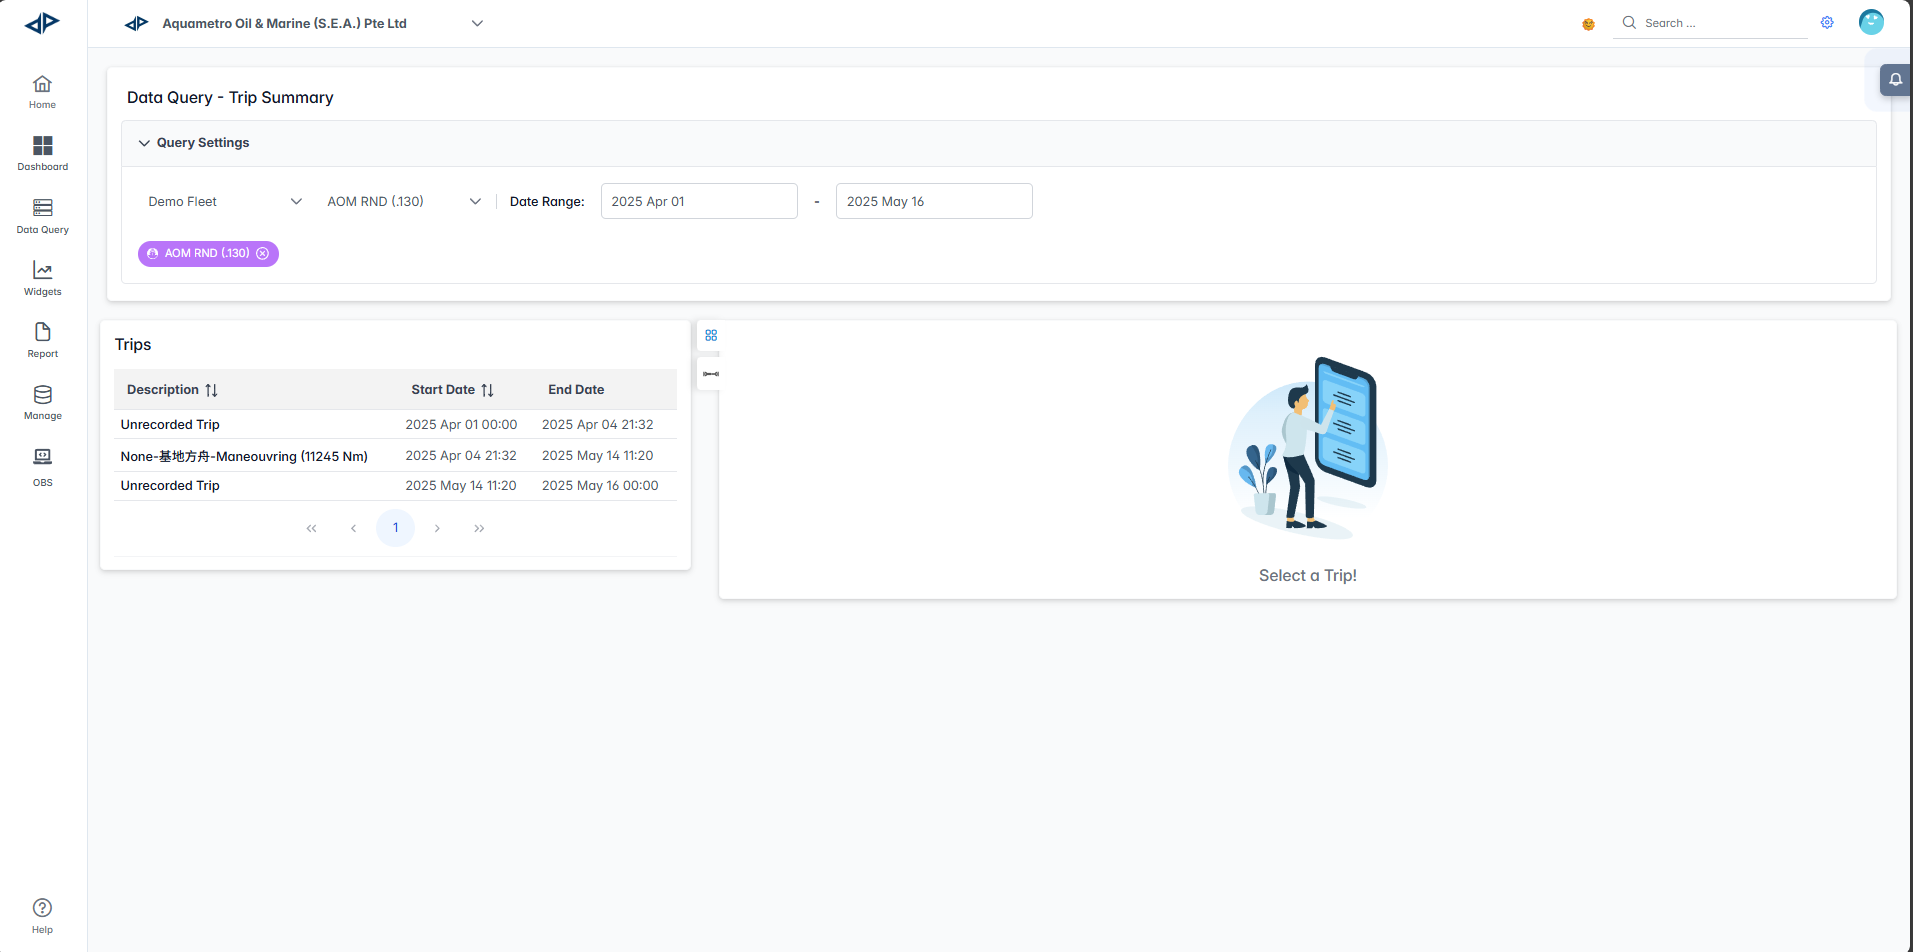
The Trip Summary interface combines trip selection, route visualization, performance analytics, and detailed event logging to provide complete voyage analysis. Users can review trip statistics, fuel consumption patterns, emissions data, and operational events for comprehensive journey assessment.
Interface Components
Query Settings Panel
The Query Settings panel allows you to configure trip analysis parameters:
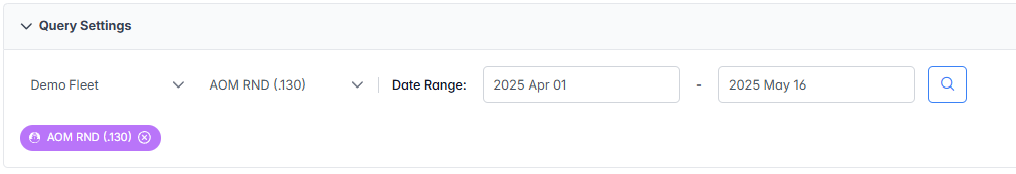
- Fleet Selector: Choose the fleet you want to analyze from the dropdown menu
- Vessel Selector: Select a specific vessel from the filtered list
- Date Range: Set start and end dates to filter trips within a specific timeframe
- Start Date: Use the calendar picker to select the beginning of your analysis period
- End Date: Use the calendar picker to select the end of your analysis period
- Apply Filters: The system automatically loads available trips based on your selected criteria
Trips Table
The main trips table displays available voyages for analysis:
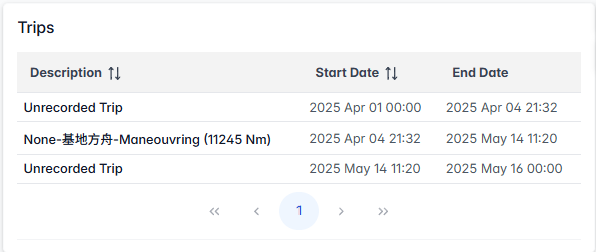
- Description: Trip identifier and details including:
- Unrecorded trips (system-generated identifiers)
- Named trips with distance information (e.g., "None-基地方舟-Manoeuvring (11245 Nm)")
- Start Date: Trip commencement date and time (YYYY MMM DD HH:MM format)
- End Date: Trip completion date and time
- Pagination: Use the arrow buttons (
<for previous page,>for next page,<<for first page, and>>for last page) to quickly move between pages of results. - Trip Selection: Click on any trip row to load detailed analysis
Trip Selection Area
Click on any trip row in trips table to load detailed summary:
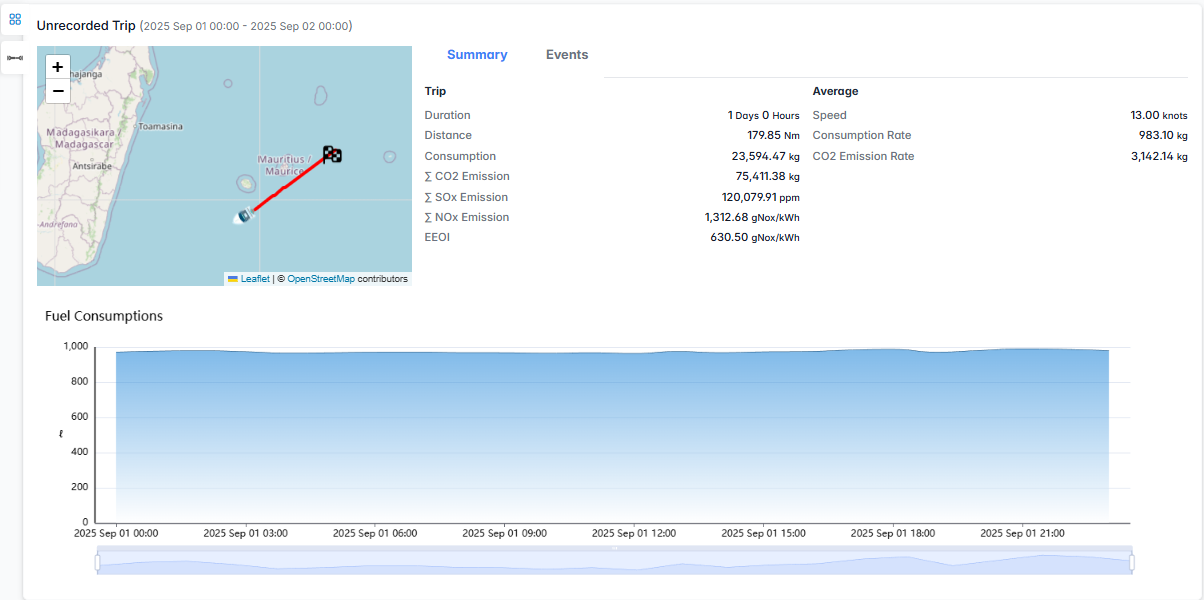
Interactive Route Map
The route visualization provides geographical context:
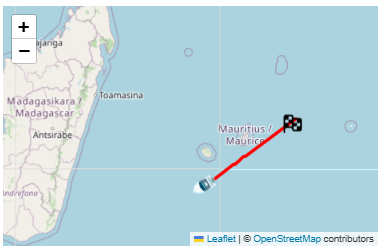
- Route Visualization: Red line showing the complete vessel journey
- Start/End Markers: Visual indicators for trip beginning and completion points
- Zoom Controls:
+and-buttons to zoom in and out of the route
Trip Statistics Panel
Summary Tab
The Summary tab displays comprehensive trip metrics:
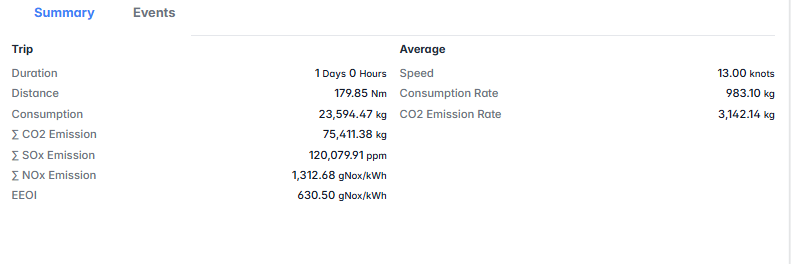
Trip Performance:
- Duration: Total trip time
- Distance: Total distance covered
- Consumption: Total fuel consumed
Emissions Data:
- Σ CO2 Emission: Total carbon dioxide emissions
- Σ SOx Emission: Total sulfur oxide emissions
- Σ NOx Emission: Total nitrogen oxide emissions
- EEOI: Energy Efficiency Operational Indicator
Average Performance:
- Speed: Average vessel speed
- Consumption Rate: Average fuel consumption rate
- CO2 Emission Rate: Average CO2 emission rate
Events Tab
The Events tab provides operational event logging:
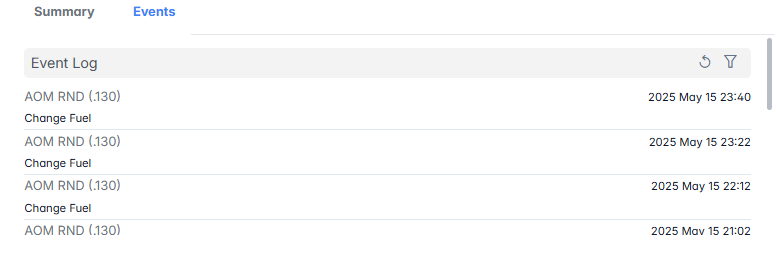
- Event Log: Chronological list of trip events
- Vessel Information: Shows vessel identifier (e.g., "AOM RND (130)")
- Event Types: Various operational events including:
- Fuel changes
- Equipment status updates
- Operational milestones
- Timestamps: Precise event timing (YYYY MMM DD HH:MM format)
- Event Filtering: Sort and filter controls for event analysis
Fuel Consumption Chart
The interactive fuel consumption visualization shows:
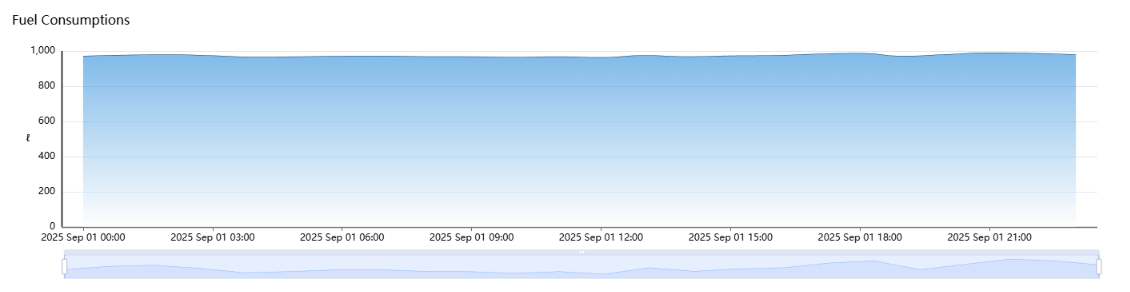
- Timeline Chart: Fuel consumption trends displayed over the course of the trip
- Time Axis: Horizontal timeline showing trip progression
- Consumption Axis: Vertical axis showing total fuel consumption
- Interactive Selection: Click and drag to select specific time periods for detailed analysis

SPM Monitor Tab
The SPM (Shaft Performance Monitoring) tab provides detailed analysis of vessel propulsion system performance throughout the trip:
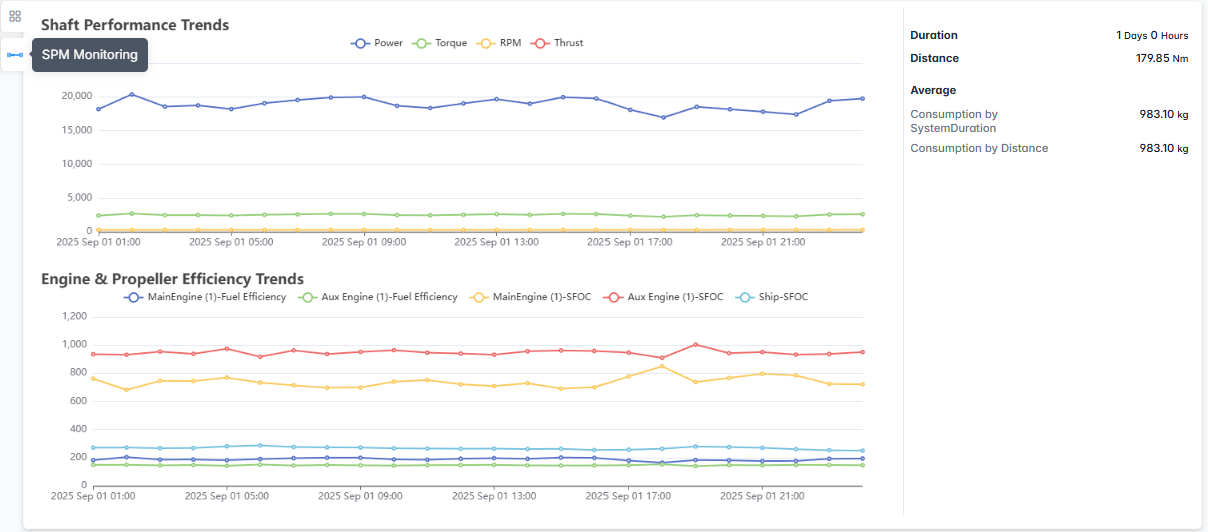
Shaft Performance Trends
The upper chart displays real-time shaft performance metrics:
- Power: Engine power output
- Torque: Shaft torque measurements showing rotational force
- RPM: Shaft revolutions per minute indicating engine speed
- Thrust: Propeller thrust generation measurements
Chart Features:
- Multi-line Display: Four different colored lines representing each performance parameter
- Time-based Analysis: X-axis shows trip progression over time
- Performance Correlation: Visual correlation between power, torque, RPM, and thrust
- Trend Identification: Easy identification of performance patterns and anomalies
Engine & Propeller Efficiency Trends
Note: The following metrics are examples. Actual parameters may vary depending on the vessel configuration.
Performance Metrics Summary:
- Duration: Total monitoring period
- Distance: Total distance covered during monitoring
- Average Consumption by System/Duration: System-based fuel consumption rate
- Average Consumption by Distance: Distance-based fuel consumption rate
The Trip Summary module provides essential voyage analysis capabilities for operational optimization, performance monitoring, and regulatory compliance reporting.