Fuel Consumption
The Fuel Consumption module provides comprehensive analysis and monitoring of vessel fuel usage within the AOMP. This feature allows users to analyze fuel consumption patterns, compare engine performance, monitor consumption breakdowns, and generate detailed reports for operational optimization and cost management.
Overview
The Fuel Consumption interface combines visual charts, detailed breakdowns, and comprehensive consumption summaries to provide complete fuel usage analysis. Users can monitor consumption trends, analyze engine-specific performance, and track fuel efficiency across different operational periods.
Interface Components
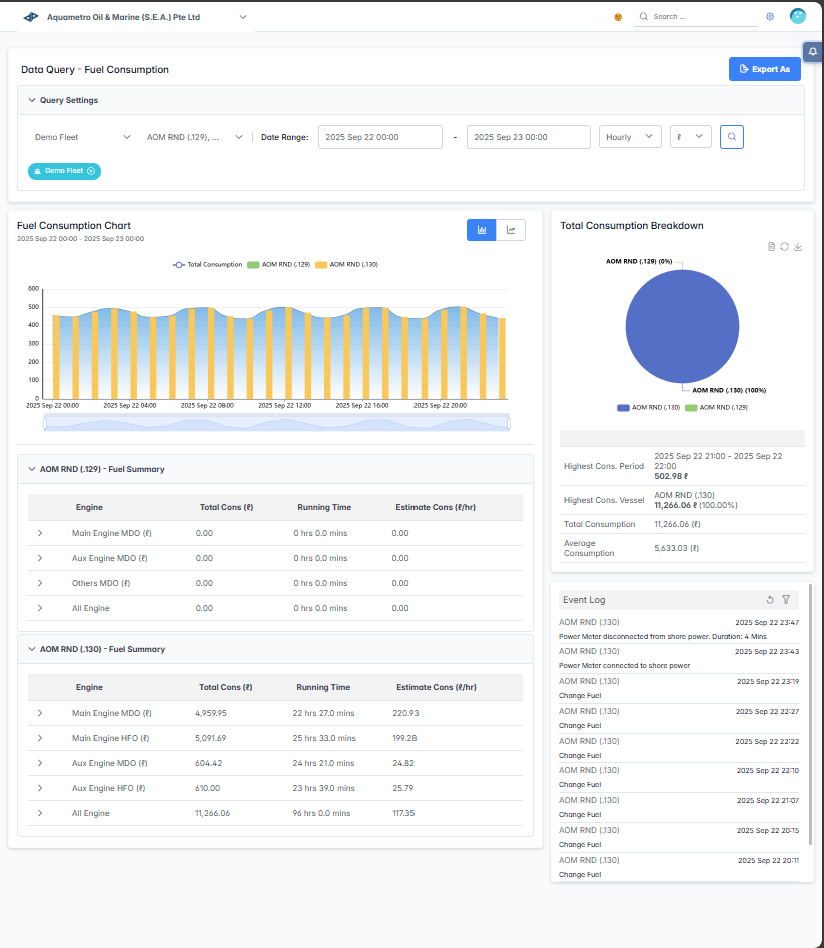
Query Settings Panel
The Query Settings panel allows you to configure fuel consumption analysis parameters:
- Fleet Selector: Choose one or more fleets to analyze from the dropdown menu (multi-select supported)
- Vessel Selector: Select one or more vessels from the filtered list, allowing multi-selection for comparative analysis
- Date Range: Set start and end dates to filter consumption data within a specific timeframe
- Start Date: Use the calendar picker to select the beginning of your analysis period
- End Date: Use the calendar picker to select the end of your analysis period
- Frequency Selector: Choose data aggregation frequency (e.g., "Daily", "Hourly", "30 Mins", "15 Mins")
- Unit Selector: Choose the unit for fuel consumption display—options include kg, ℓ, and US Gal
- Apply Filters: The system automatically loads available trips based on your selected criteria
- Export Function: "Export All" button to download comprehensive fuel consumption reports in CSV or Excel format
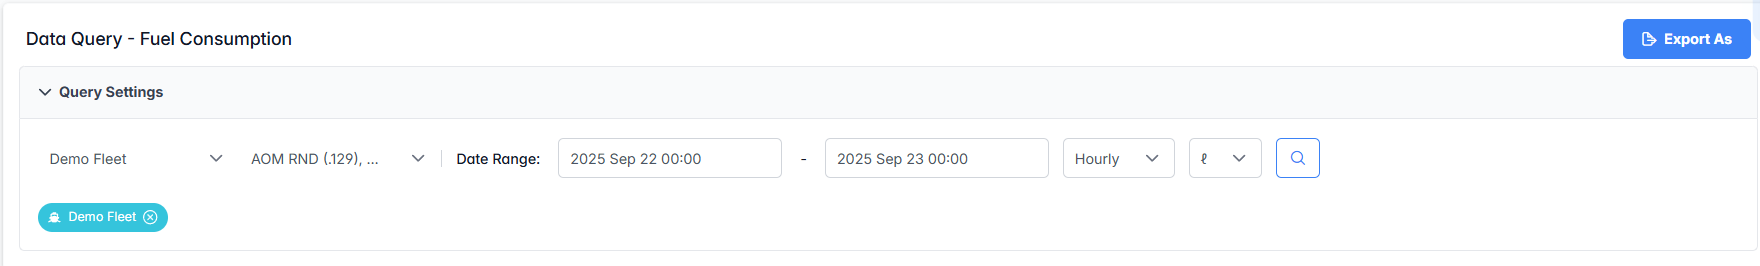
Fuel Consumption Chart
The main visualization displays fuel consumption trends over time:
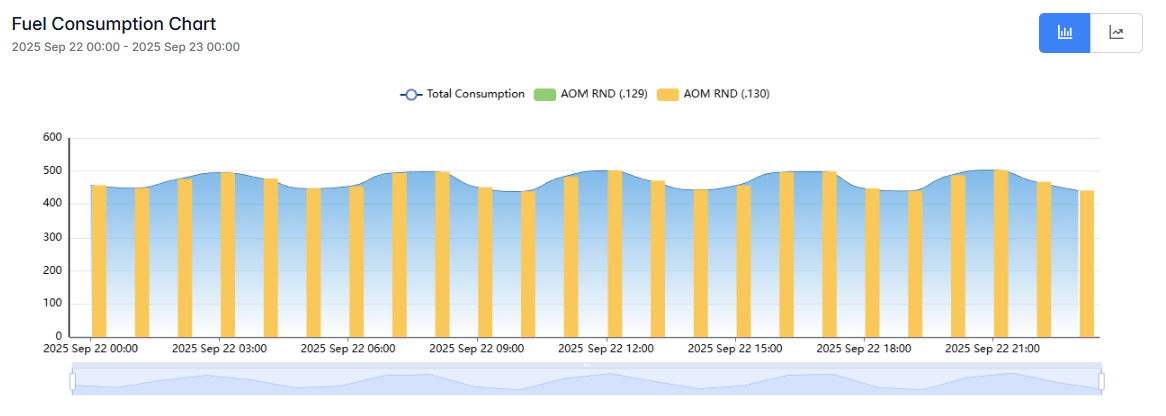
Chart Features:
- Multi-vessel Display: Different colored bars for each vessel (e.g., AOM RND (129), AOM RND (130))
- Time-based Analysis: X-axis shows consumption over the selected time period
- Consumption Scale: Y-axis displays fuel consumption values
- Interactive Legend: Click vessel names to show/hide specific vessel data
- Bar Chart Format: Easy comparison of consumption across different time periods
- Interactive Selection: Click and drag to select specific time periods for detailed analysis

Total Consumption Breakdown
The pie chart provides visual breakdown of fuel consumption by vessel:
Consumption Statistics Panel
The panel below the pie chart displays key consumption metrics:
-
Highest Cons. Period: Peak consumption period analysis
- Time Range: Specific date and time period when highest consumption occurred (e.g., "2025 Sep 22 21:00 - 2025 Sep 22 22:00")
- Consumption Value: Actual fuel consumption during the peak period (e.g., "502.98 ℓ")
-
Highest Cons. Vessel: The vessel with the highest fuel consumption
- Vessel Identification: Name and identifier of the vessel with the highest consumption (e.g., "AOM RND (130)")
- Total Consumption: Total fuel consumed by this vessel (e.g., "11,266.06 ℓ")
- Percentage: Proportion of this vessel's consumption relative to the total fleet consumption (e.g., "100.00%")
-
Total Consumption: Overall consumption summary
- Combined Total: Sum of fuel consumption across all selected vessels (e.g., "11,266.06 (ℓ)")
- Unit Display: Shows consumption in selected units (liters, kilograms, US gallons)
-
Average Consumption: Mean consumption analysis
- Average Rate: Mean fuel consumption rate across the analysis period (e.g., "5,633.03 (ℓ)")
- Calculation Basis: Average calculated as total consumption divided by the number of vessels (total cons / vessel quantity)
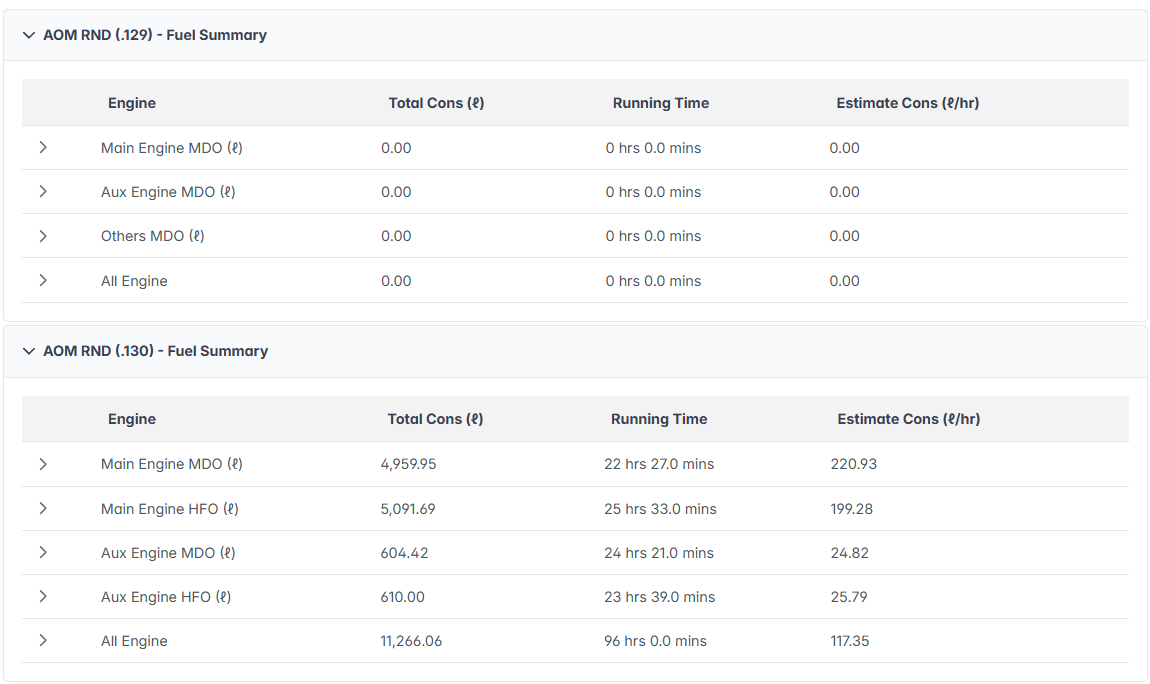
Consumption Summary Tables
Expandable sections showing detailed fuel consumption by vessel
Event Log Integration
The Event Log section correlates fuel consumption with operational events:
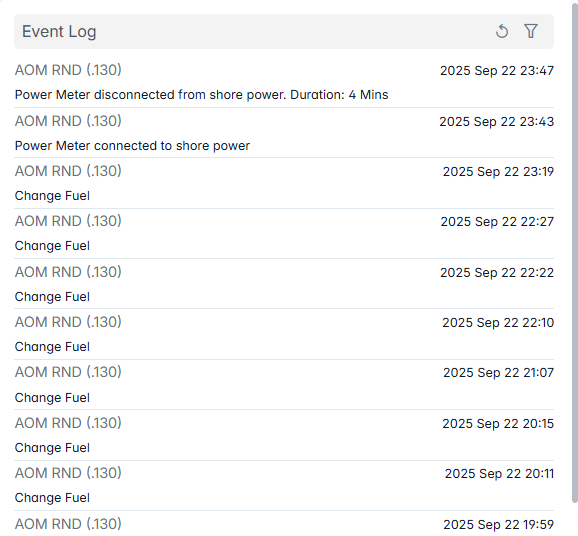
- Event Timeline: Chronological list of fuel-related events
- Event Types: Various consumption-related events
- Timestamps: Precise event timing for consumption analysis
The Fuel Consumption module provides essential capabilities for monitoring, analyzing, and optimizing vessel fuel usage for operational efficiency and cost management.