Engine Summary
The Engine Summary provides comprehensive analysis and monitoring of individual engine performance within the AOM (Aquametro Oil & Marine) system. This specialized interface allows users to monitor engine operational parameters, analyze fuel consumption patterns, track performance metrics, and review real-time engine data through detailed dashboards and charts for optimal engine management and efficiency optimization.
Overview
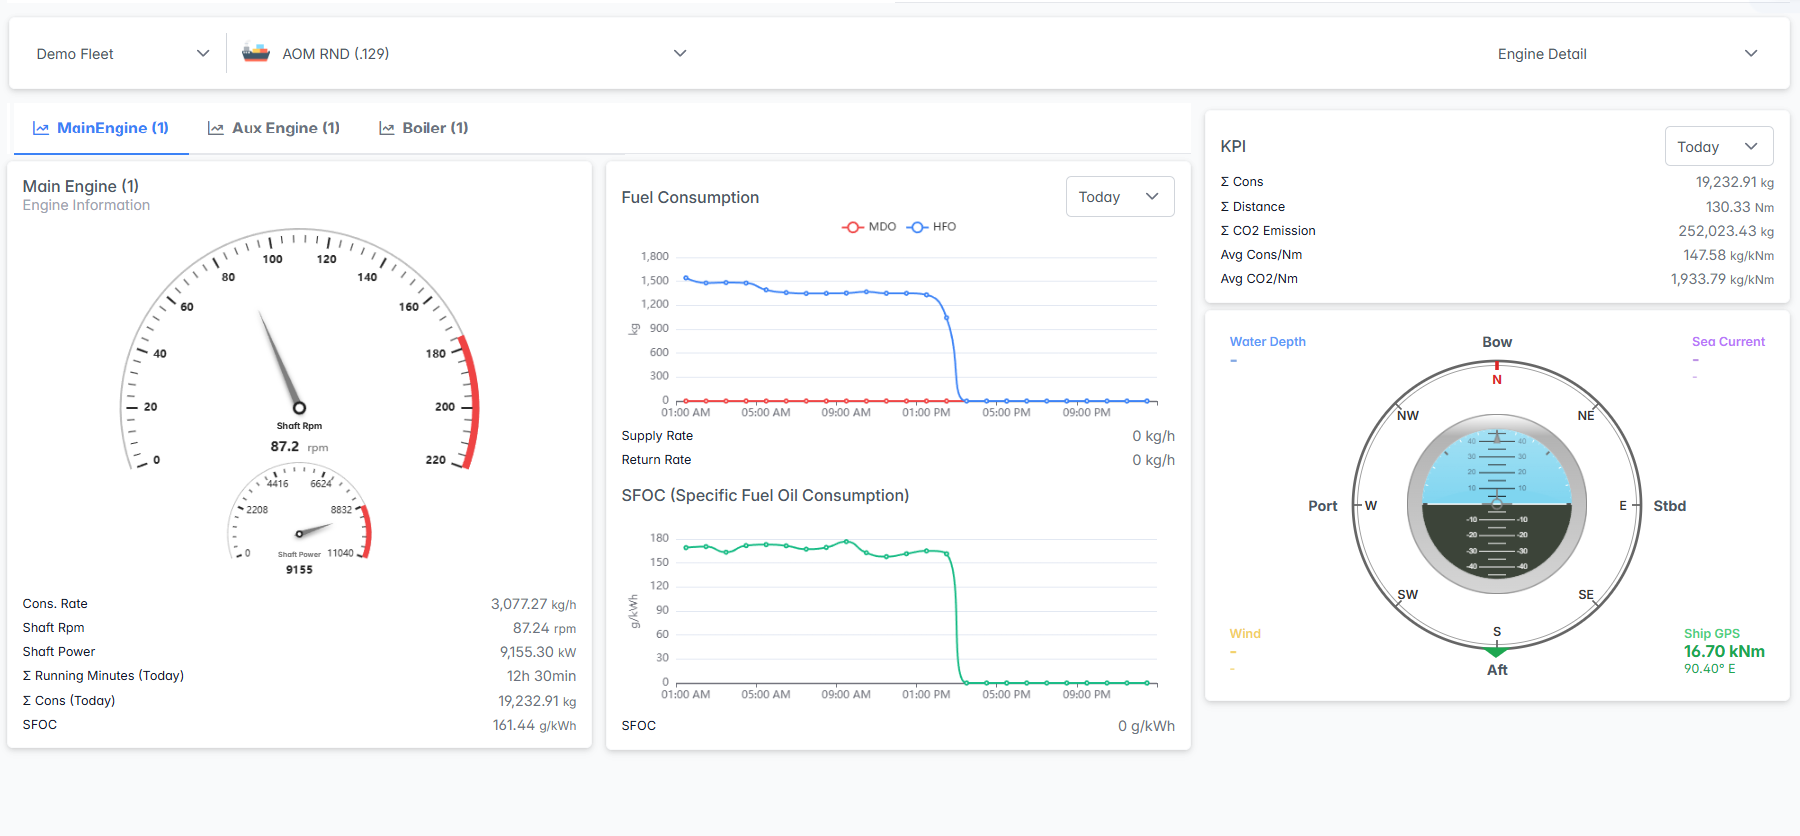
The Engine Summary interface combines engine selection, performance visualization, fuel consumption analysis, and real-time operational data to provide complete engine oversight. Users can monitor shaft RPM, power output, consumption rates, SFOC values, and navigation data through integrated gauges, charts, and KPI displays for comprehensive engine performance management.
Interface Components
Fleet and Vessel Selection Panel
The top navigation panel provides fleet, vessel, and analysis configuration:

- Fleet Selector: Choose the fleet from the dropdown menu
- Vessel Selector: Select specific vessel from the fleet
- Engine Detail Selector: Choose analysis type from the dropdown
Engine Detail
Engine Navigation Tabs
The engine selection tab bar allows switching between different engines and systems:

Tab Features:
- Active Tab Indication: Selected engine highlighted with blue background
- Quick Switching: Click any tab to switch engine analysis
- System Coverage: Complete coverage of all vessel propulsion and fuel systems
- Real-time Data: Each tab provides real-time data for the respective system
Engine Performance Panel
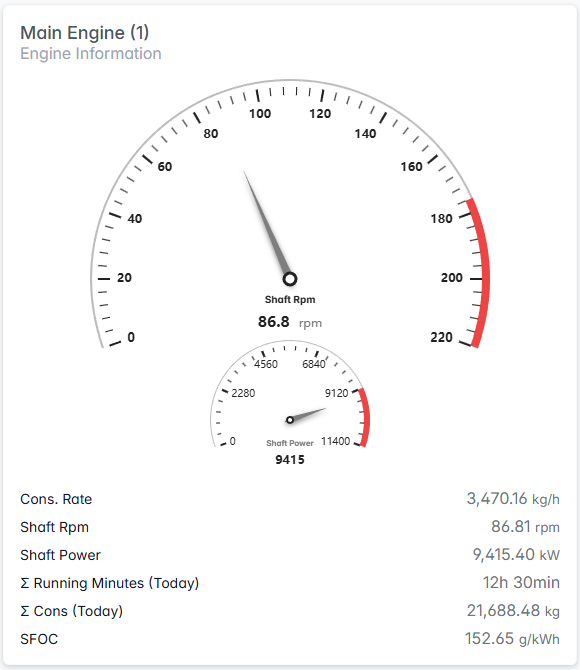
Primary Gauges:
- Shaft RPM & Power Gauges: Circular gauges display both engine speed and power output at a glance.
- Show current RPM and power values together
- Visual indicators highlight normal and warning ranges
- Easy-to-read analog style for quick status checks
Performance Metrics Table:
- Cons. Rate: Current consumption rate
- Shaft Rpm: Precise RPM reading
- Shaft Power: Engine power output
- Σ Running Minutes (Today): Daily operation time
- Σ Cons (Today): Total daily consumption
- SFOC: Specific Fuel Oil Consumption
Fuel Consumption Analysis
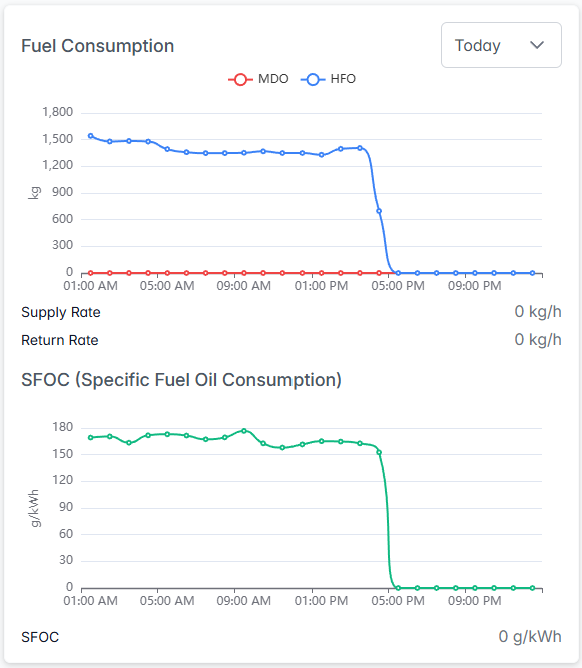
Fuel Consumption Chart:
Dual Fuel Tracking: Visualizes both Heavy Fuel Oil (HFO) and Marine Gas Oil (MGO) consumption, allowing users to monitor and compare usage patterns for each fuel type in real time.
- Time Period Selection: Configurable time range analysis with dropdown options:
- Today: Current day analysis (24-hour tracking)
- Last 7 Days: Weekly consumption patterns and trends
- Last 30 Days: Monthly analysis for long-term performance review
- Real-time Rates: Supply Rate and Return Rate
- Interactive Timeline: Time intervals adjusted based on selected period
SFOC Performance Chart:
- Efficiency Tracking: Specific Fuel Oil Consumption over time
- Performance Baseline: SFOC value monitoring (0 g/kWh)
- Efficiency Trends: Visual representation of engine efficiency changes
- Correlation Analysis: SFOC data correlated with consumption patterns
Dual Engine Detail
When "Dual Engine Detail" is selected from the Engine Detail dropdown, the interface displays a side-by-side comparison view of multiple engines:
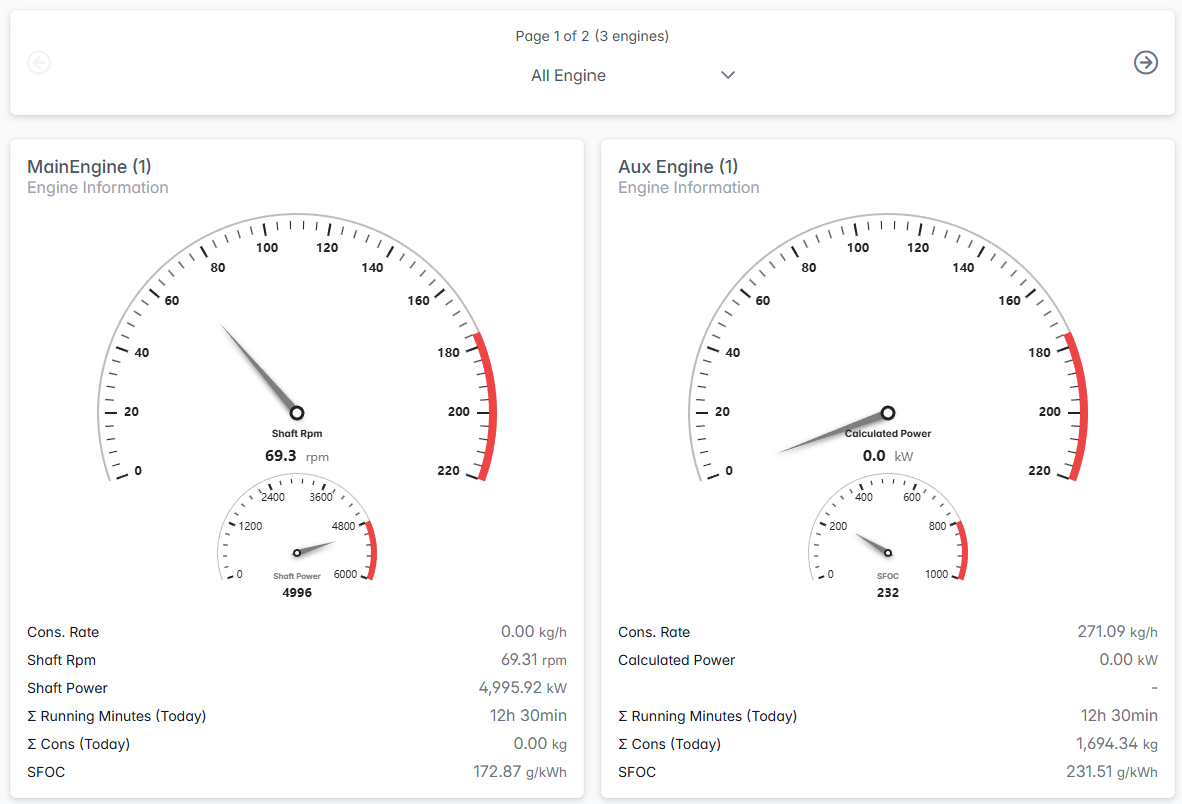
Comparative Engine Display
Page Navigation:
- Page Indicator: Shows current page position (e.g., "Page 1 of 2 (3 engines)")
- Engine Filter: Dropdown to select specific engines for comparison (e.g., "All Engine")
- Navigation Controls: Arrow buttons to navigate between different engine pages
Comparative Analysis Features
Performance Comparison:
- Direct Comparison: Side-by-side metrics for easy performance comparison
- Real-time Data: Simultaneous monitoring of multiple engines
- Efficiency Analysis: Compare SFOC values between different engine types
- Load Distribution: Analyze load sharing between main and auxiliary engines
Visual Layout:
- Dual Panel Design: Equal space allocation for each engine
- Consistent Gauge Layout: Standardized gauge presentation for easy comparison
- Synchronized Data: All engines display data from the same time period
- Comprehensive Metrics: Complete performance data for each engine system
Key Performance Indicators (KPI)
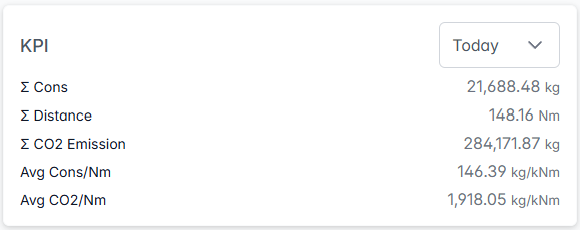
Daily Performance Summary:
- Σ Cons: Total consumption
- Σ Distance: Distance covered
- Σ CO2 Emission: CO2 emissions
- Avg Cons/Nm: Average consumption per nautical mile
- Avg CO2/Nm: Average CO2 per nautical mile
Time Period Selector:
- Today: Current day analysis (default selection)
- Last 7 Days: Weekly performance trends and analysis
- Last 30 Days: Monthly performance review and historical comparison
Navigation and Environmental Data
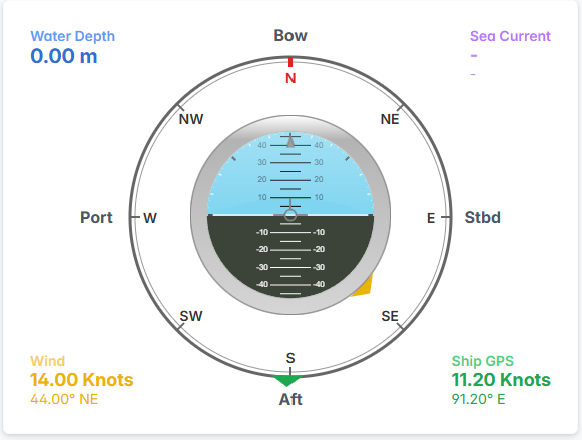
Environmental Monitoring:
- Water Depth: Current depth indicator with visual display
- Wind: Wind conditions indicator (shown in yellow)
Navigation Compass:
- Circular Display: Traditional compass layout
- Cardinal Directions: N, NE, E, SE, S, SW, W, NW markings
- Bow Indicator: Current vessel heading direction
- Sea Current: Current direction and strength (purple indicator)
- Position Reference: Port and Starboard orientation
The Engine Summary serves as the comprehensive command center for multi-engine performance analysis, providing detailed insights into individual engine efficiency, comparative performance analysis, and operational optimization essential for effective vessel propulsion management and fuel efficiency optimization.