SPM Monitoring
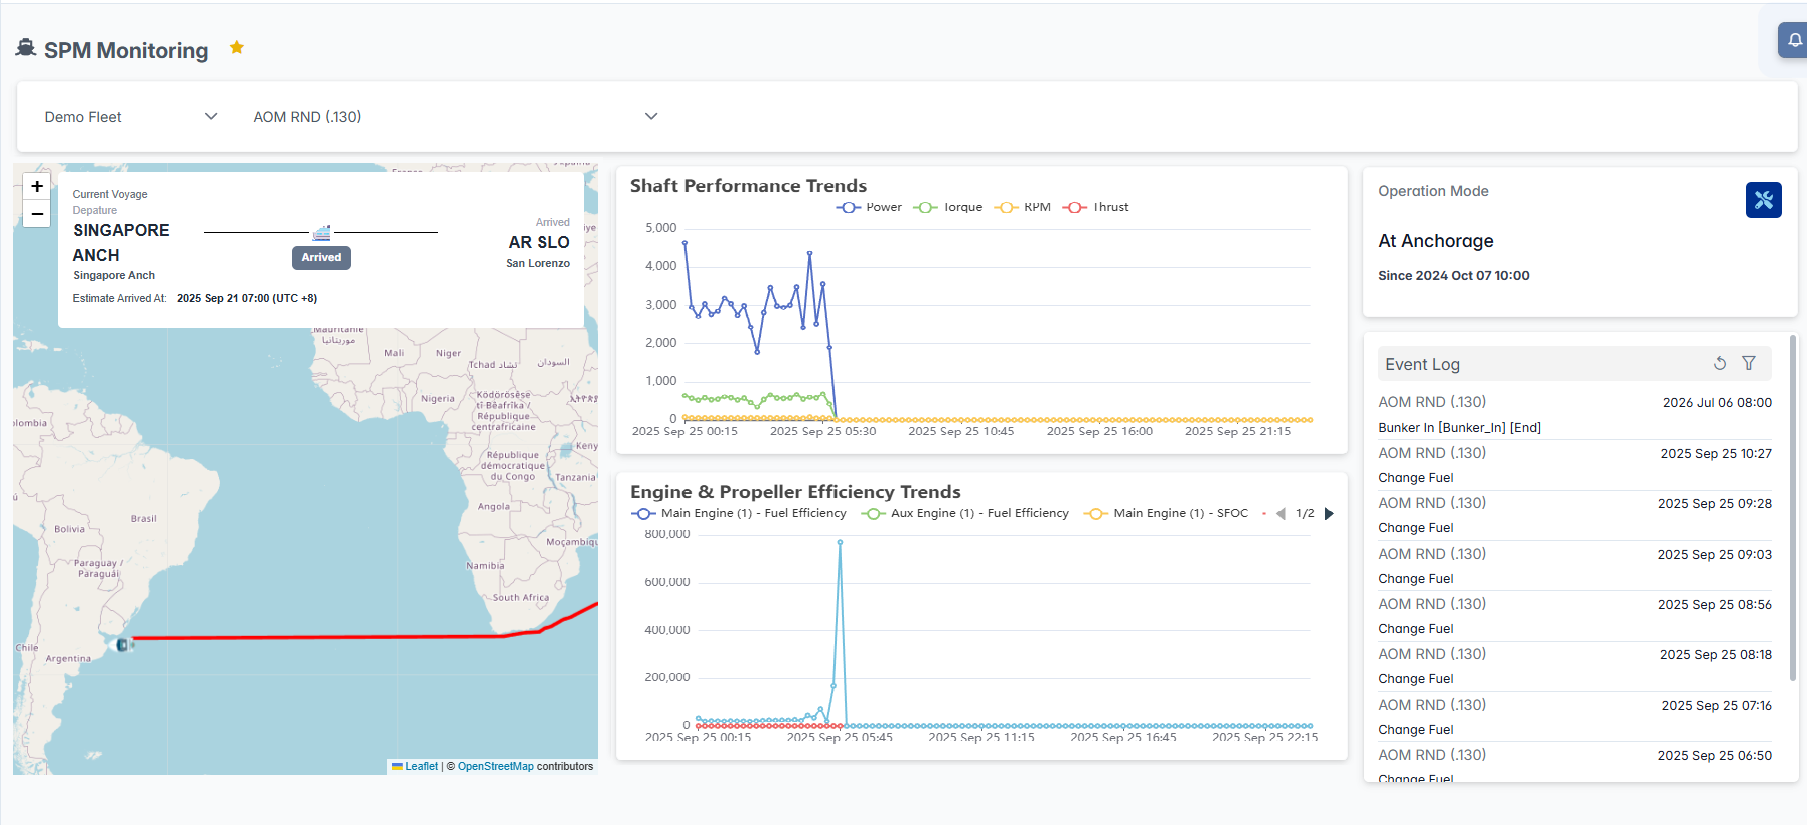
The SPM (Shaft Performance Monitoring) module provides a real-time view of propulsion system performance, engine & propeller efficiency, and operational context for a selected vessel. Use this page to monitor shaft loads, power and thrust trends, inspect engine efficiency (SFOC), and correlate performance with voyage events and operation mode.
Overview
SPM Monitoring is designed for performance engineers, ship operators and fleet managers who need quick insight into propulsion behaviour and fuel efficiency during a voyage. The screen combines a map (route), performance charts, an operation mode card, and an event log for correlation.
Interface Components
Query Settings Panel

- Fleet Selector: Choose the fleet you want to analyze from the dropdown menu
- Vessel Selector: Select a specific vessel from the filtered list
Route Map
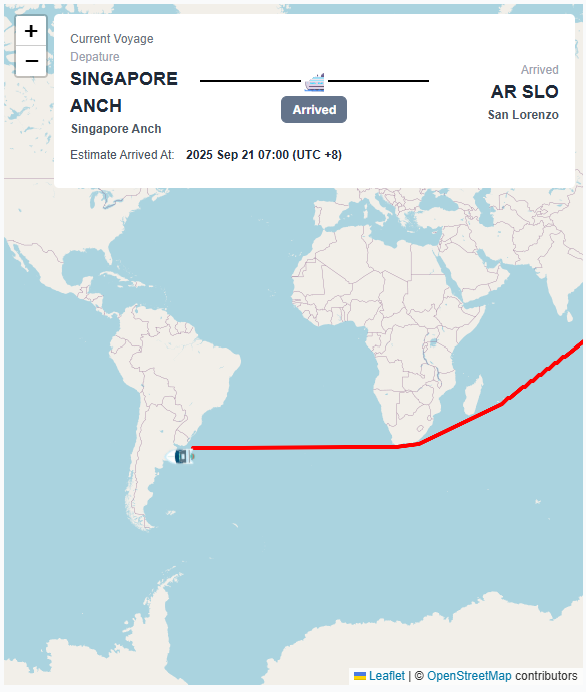
- Shows the vessel track for the selected monitoring period.
- Start and end markers and the active track are displayed for quick geographic context.
Shaft Performance Trends
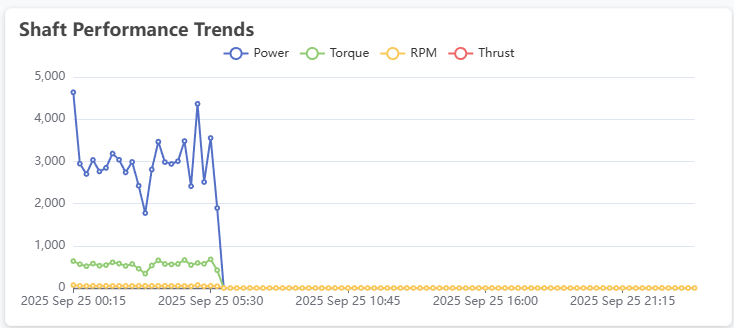
- Multi-series time chart showing:
- Power
- Torque
- RPM
- Thrust
- Data is displayed starting from 00:00 of the current day.
- Use the legend to toggle individual series on or off.
Engine & Propeller Efficiency Trends
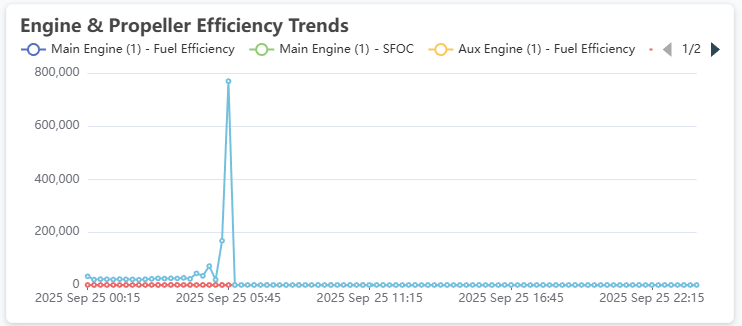
- Displays derived efficiency metrics.
- Data is shown from the beginning of the current day (00:00).
- Use this chart to compare engine behaviours and identify degraded efficiency periods.
Operation Mode Card
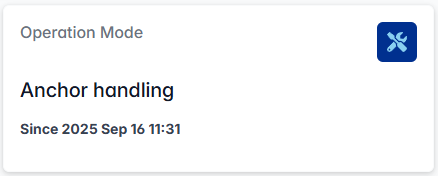
- Shows the vessel's current operation mode
- Includes the mode start timestamp for quick context on how long the vessel has been in the mode.
Event Log
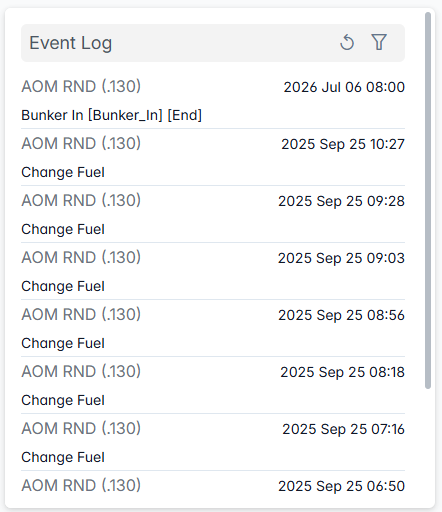
- Chronological list of recent events.
- Use the filter / refresh controls to tailor event visibility.
Use the SPM Monitoring page for fast, visual correlation between ship position, shaft performance and fuel efficiency to help optimise operations and detect issues early.