Signal Dashboard
The Signal Dashboard provides comprehensive monitoring and analysis of vessel sensor data and measurement parameters within the AOMP. This interface allows users to monitor fuel flow rates, supply and return meter readings, engine parameters, and other critical vessel signals in real-time for operational oversight and performance analysis.
Overview
The Signal Dashboard interface combines vessel selection, parameter filtering, and hierarchical signal organization to provide complete sensor data monitoring. Users can track flow totalizers, supply rates, temperature readings, density measurements, and engine performance parameters through an organized tree structure for efficient data access and analysis.
Interface Components
Vessel Selection Panel
The top navigation panel provides fleet and vessel selection with parameter filtering:
- Fleet Selector: Choose the fleet from the dropdown menu
- Vessel Selector: Select specific vessel from the fleet
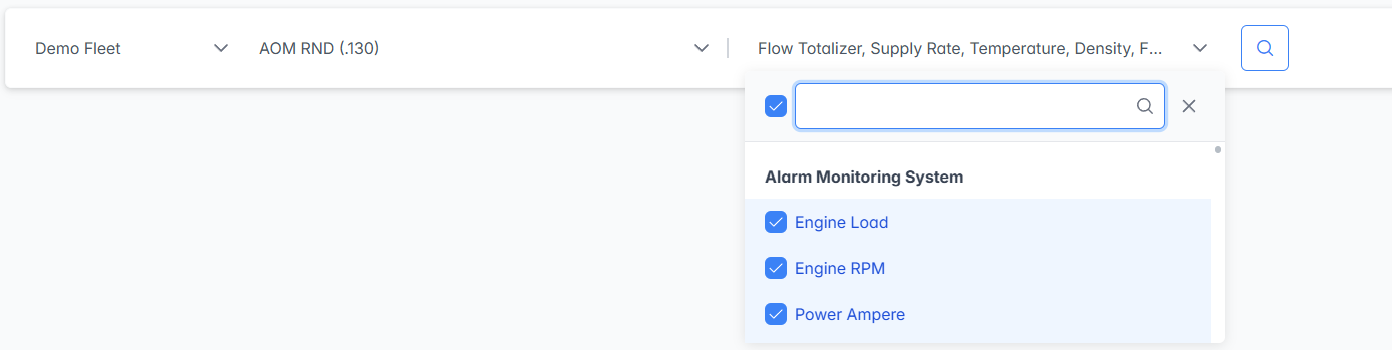
- Parameter Filter: Multi-select parameter dropdown for filtering displayed signals
- Displays selected parameters in the dropdown header
- Search functionality with search bar for quick parameter location
- Organized by engine categories for easy navigation
Signal Hierarchy Tree
The main interface displays sensor data organized in a hierarchical tree structure after clicking the search icon in the selection panel:
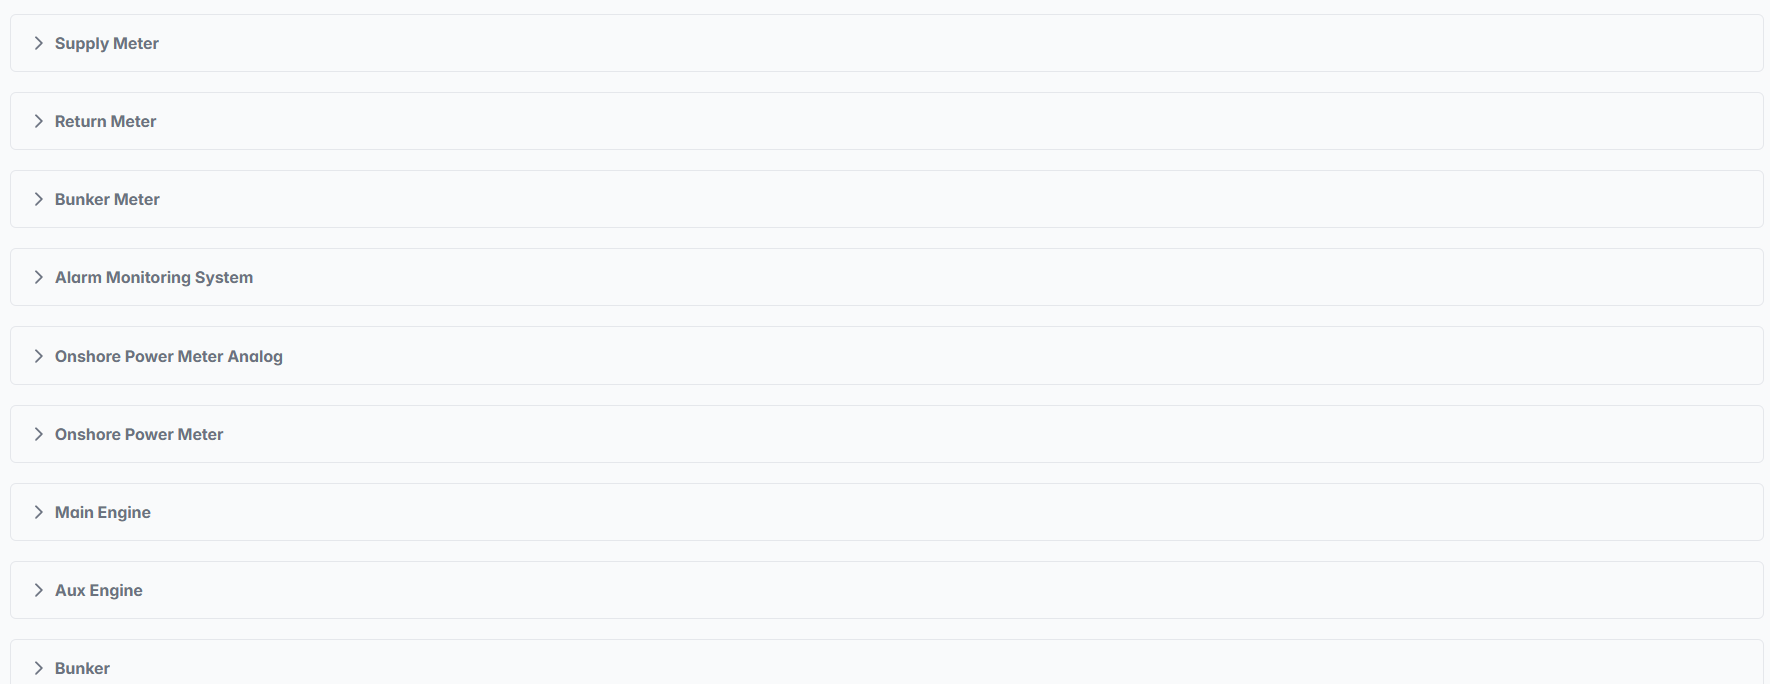
Navigation Features
Expandable Structure:
- Collapse/Expand Icons: Click arrow icons to expand or collapse each section
- Hierarchical Organization: Logical grouping of related parameters
- Quick Access: Expand only relevant sections for focused monitoring
- Search Integration: Tree structure filters based on parameter selection
Visual Organization:
- Category Headers: Clear section headings for each system type
- Indented Structure: Sub-categories clearly indented under main categories
- Consistent Formatting: Uniform appearance across all sections
- Status Indicators: Visual cues for section status and data availability
Expandable Categories:
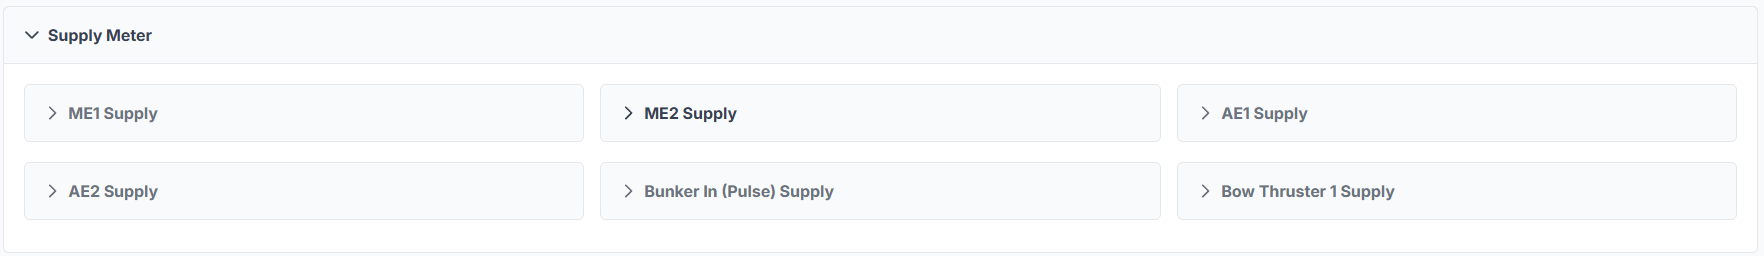
- Click on any section to expand and view detailed sub-categories
- Each expanded section shows engine-specific measurements and specialized systems
- Sub-categories include individual equipment
- Click on individual sub-categories to view detailed parameter tables
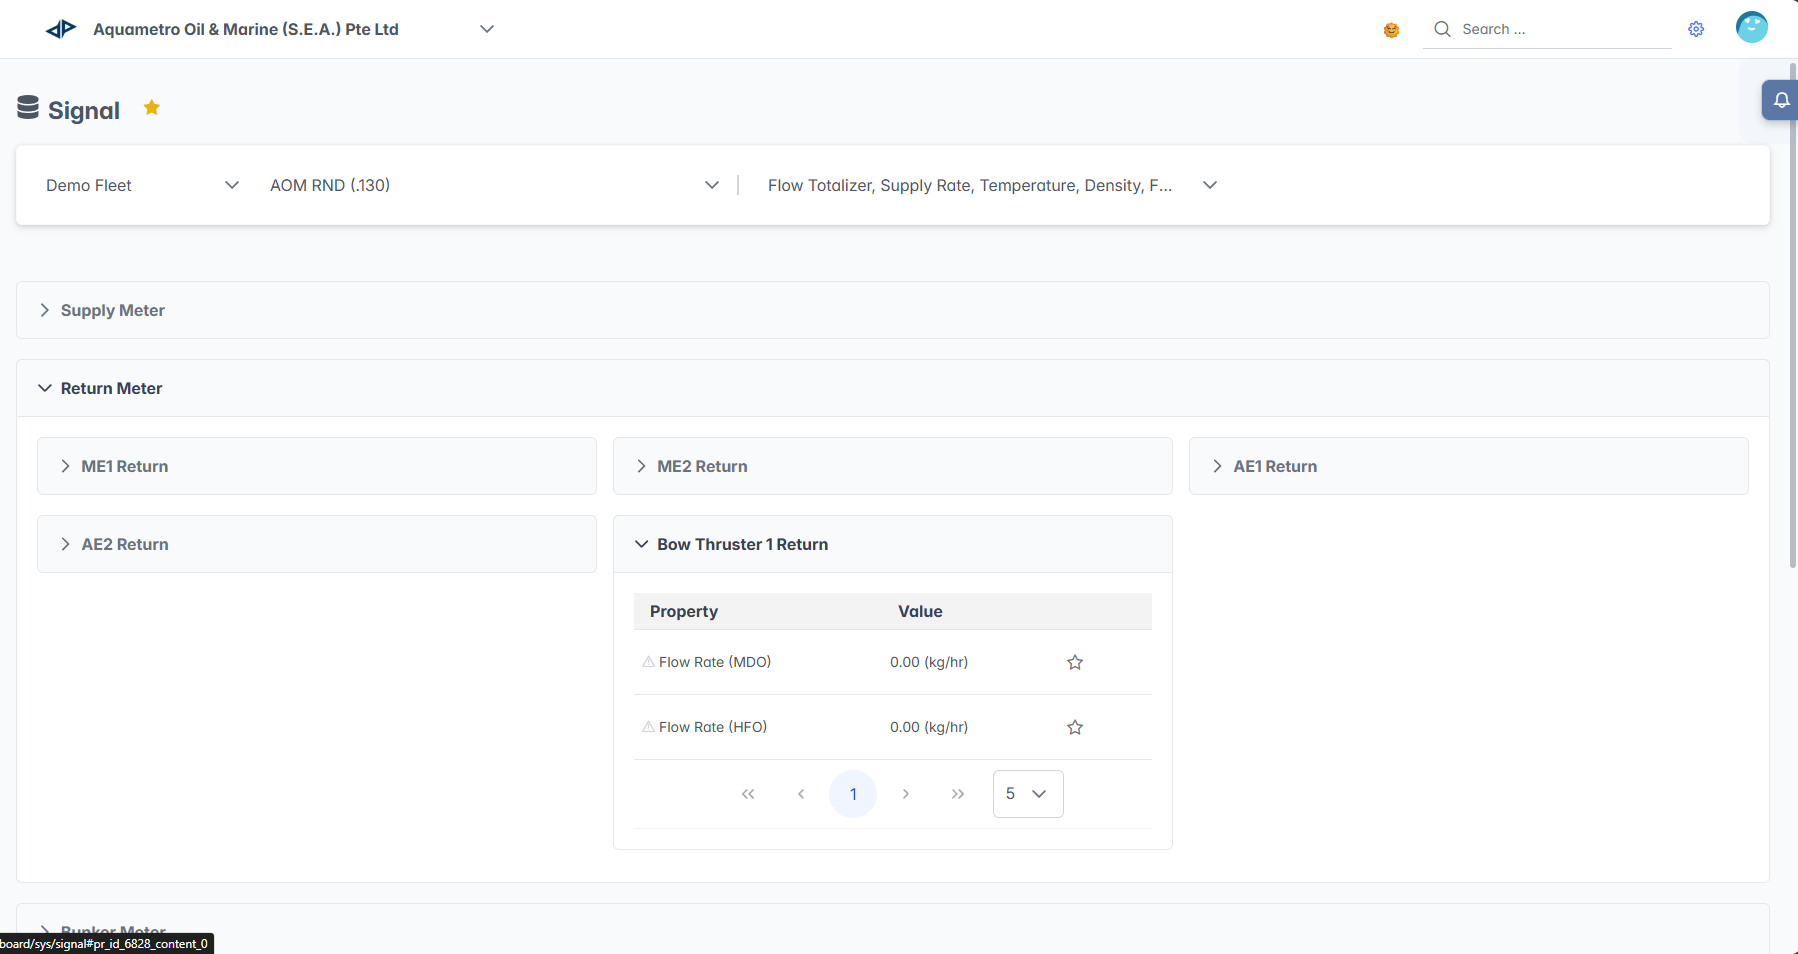
Detailed Parameter View
When you expand an individual sub-category, it shows a data table with specific measurements:
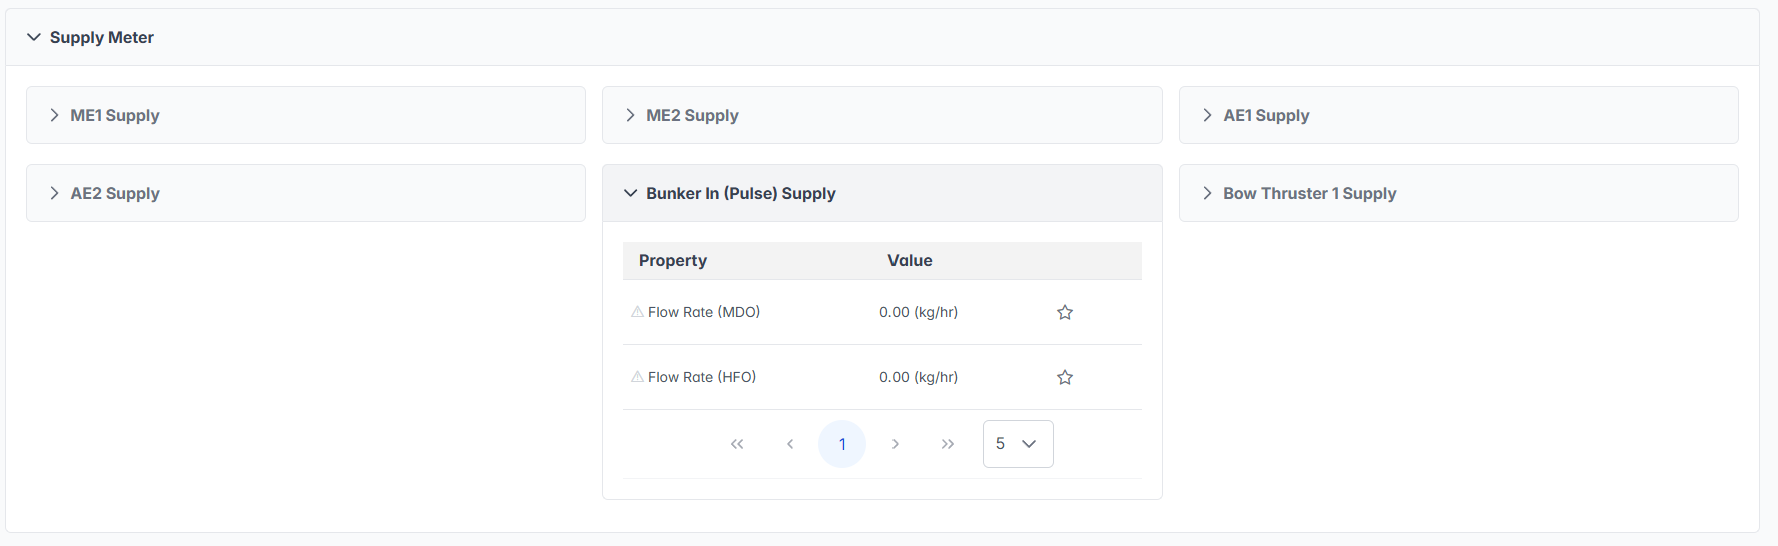
Table Structure:
- Property Column: Specific measurement parameter names
- Value Column: Real-time measurement values with units
- Star Icons: Bookmark or favorite functionality for important parameters
- Pagination: Navigation controls for large parameter lists
The Signal Dashboard serves as the primary interface for real-time vessel sensor monitoring, providing comprehensive access to critical operational parameters essential for safe and efficient vessel operations, maintenance planning, and performance optimization.